
Filebeat + elasticsearch+kibana日志收集
浏览量:294
Filebeat + elasticsearch+kibana
注意:版本一致7.12.1,linux环境下安装,路径:/usr/local/soft
1.filebeat
官方文档:https://www.elastic.co/guide/en/beats/filebeat/current/filebeat-installation-configuration.html
下载地址:https://www.elastic.co/cn/downloads/beats/filebeat
安装步骤:linux 安装
curl -L -O https://artifacts.elastic.co/downloads/beats/filebeat/filebeat-7.12.1-linux-x86_64.tar.gz
tar xzvf filebeat-7.12.1-linux-x86_64.tar.gz
进入目录 cd /usr/local/soft/filebeat/filebeat-7.12.1-linux-x86_64/modules.d
执行 ./filebeat modules list (启动和编辑收集)
执行 ./filebeat modules enable system nginx mysql (启用一个/多个模块,nginx和mysql)
进入目录:cd /usr/local/soft/filebeat/filebeat-7.12.1-linux-x86_64/modules.d
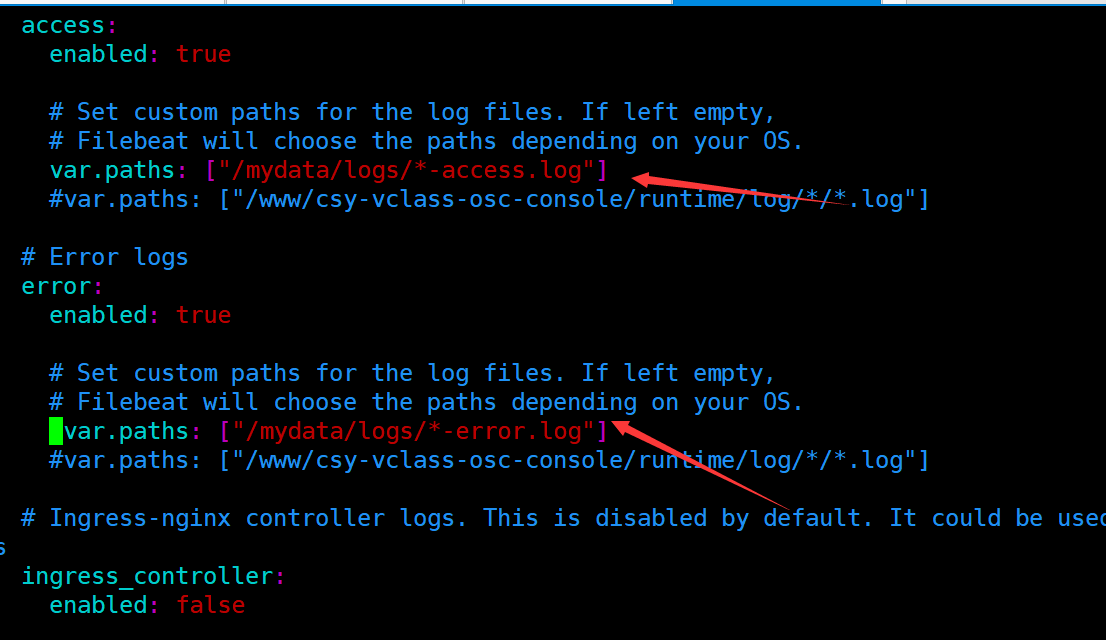
修改nginx.yml
修改完文件保存:执行这个文本 ./filebeat test config -e 检测你的配置是不是对
继续执行: ./filebeat setup -e (确保你又权限执行)
最后启动: ./filebeat -e

需要注意的是:
setup.ilm.enabled: auto
setup.ilm.rollover_alias: "filebeat"
setup.ilm.pattern: "{now/d}-000001"
Filebeats从版本7.0起,生命周期需要自己管理es的索引了,
收集多个项目并按照不用的索引展示信息:配置文件
# ============================== Filebeat inputs ===============================
filebeat.inputs:
- type: log
  # Change to true to enable this input configuration.
  enabled: true
  # Paths that should be crawled and fetched. Glob based paths.
  paths:
    #- /var/log/*.log
    - /www/tp5/runtime/log/*/*.log
    #- c:\programdata\elasticsearch\logs\*
  fields:
     indexprefix: "tplog_5"
  json.add_error_key: true
- type: log
  enabled: true
  paths:
    - /www/csy-vclass-osc-console/runtime/log/*/*.log
  fields:
    indexprefix: "tplog_osc"
# ---------------------------- Elasticsearch Output ----------------------------
setup.ilm.enabled: false
setup.template.name: "thinkphp_log"
setup.template.pattern: "thinkphp_log-*"

output.elasticsearch:
  # Array of hosts to connect to.
  hosts: ["127.0.0.1:9200"]
  index: "%{[fields][indexprefix]}-%{+yyyy.MM.dd}"
2.elasticsearch
官方文档:https://www.elastic.co/guide/en/elasticsearch/reference/current/targz.html
wget https://artifacts.elastic.co/downloads/elasticsearch/elasticsearch-7.12.1-linux-x86_64.tar.gz
安装:tar -xzf elasticsearch-7.12.1-linux-x86_64.tar.gz
目录:cd elasticsearch-7.12.1/
需要注意的是:
新版的elasticsearch,不让用root用户启动,所以你需要新建一个新的用户再去执行
我这边把整合elasticsearch设置新的权限
useradd lianghuiju 新增用户
passwd lianghuiju 设置密码
chown lianghuiju:lianghuiju elasticsearch 整个文件用lianghuiju用户执行
chown 777 elasticsearch lianghuiju用户有最高的权限
执行:./bin/elasticsearch
在需要注意点:
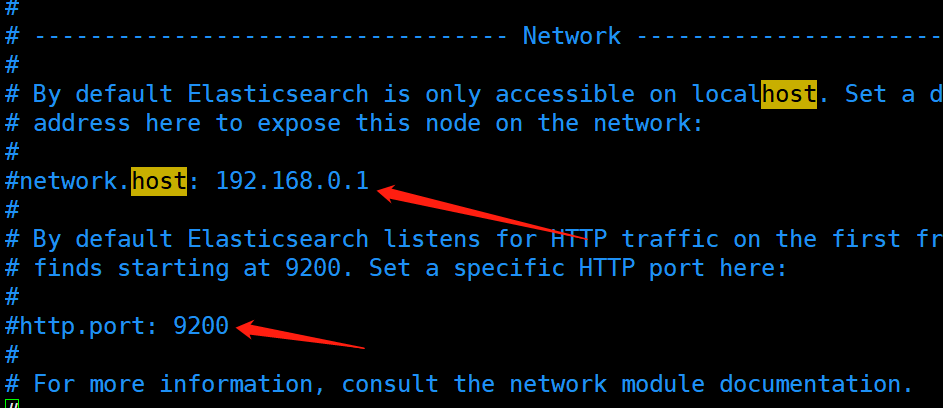
elasticsearch 外网不能访问,
修改 vim /usr/local/soft/elasticsearch/elasticsearch-7.12.1/config/elasticsearch.yml
但是我不可以,需要代理转发出去 Nginx 配置TCP代理转发出去:
vim /usr/local/soft/openresty/nginx/conf/nginx.conf
stream {
log_format proxy '$remote_addr [$time_local] '
'$protocol $status $bytes_sent $bytes_received '
'$session_time "$upstream_addr" '
'"$upstream_bytes_sent" "$upstream_bytes_received" "$upstream_connect_time"';
access_log /mydata/logs/tcp-access.log proxy ;#日志地址需要你
open_log_file_cache off;
include tcpConf/*.conf; # 统一放置,方便管理
}
在/usr/local/soft/openresty/nginx/conf目录里面需要常见一个文件夹tcpConf
在/usr/local/soft/openresty/nginx/conf/tcpConf里面创建一个tcp9004.conf
内容:
upstream tcp9004 {
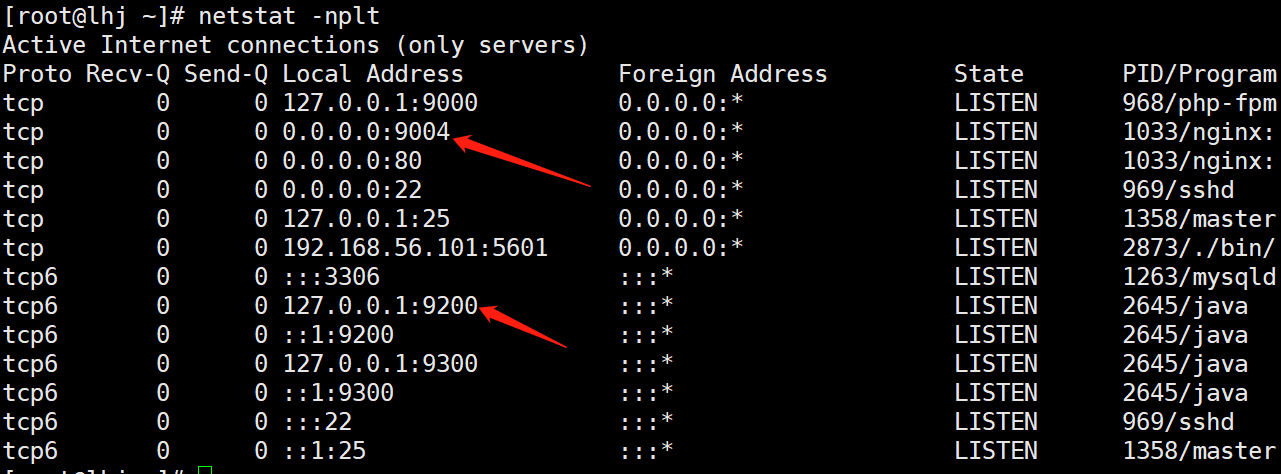
server 127.0.0.1:9200;//把9200代理出去,端口用9004
}
server {
listen 9004;
proxy_connect_timeout 8s;
proxy_timeout 24h;
proxy_pass tcp9004;
}
记得服务器重启:service nginx restart
3.kibana
文档地址:https://www.elastic.co/cn/start
下载 curl -O https://artifacts.elastic.co/downloads/kibana/kibana-7.12.1-linux-x86_64.tar.gz
解压 tar -xzf kibana-7.12.1-linux-x86_64.tar.gz
进入目录cd kibana-7.12.1-linux-x86_64/
执行 ./bin/kibana
注意:
Kibana和es是一样的,也不让root用户启动
配置文件:
i18n.locale: "zh-CN" #kibana展示为中文
elasticsearch.hosts: ["http://192.168.56.101:9004"] #配置好es
kibana.index: ".kibana"
server.port: 5601 #启动端口
server.host: "192.168.56.101" #kibana配置ip便于外网访问
进入虚拟机需要看你自己的ip

神回复
发表评论:
◎欢迎参与讨论,请在这里发表您的看法、交流您的观点。